Digital urban planning
Our cities are growing. Therefore, urban planning must take into account the needs of more and more people. The DLR Digital Atlas project is creating a unique database that can be used to better develop urban planning and energy supply.
The following applies specifically to traffic planning: citizens, city administrations, vehicle manufacturers and transport companies want the narrow traffic space to be used as trouble-free and safely as possible. To do this, they need valid information, i.e. data. And these should preferably not come from many different sources with different bases, but from one source. Only then can they be combined with each other and meaningfully evaluated. In the DLR cross-sectional project Digital Atlas, scientists from ten DLR institutes are building a database that can be used to better develop and organise urban planning as well as energy supply.
The main focus is on geodata, i.e. digital information to which a spatial location on the Earth's surface is assigned. This includes traffic on the ground as well as on water and in the air. The researchers use information from satellites and aircraft as well as sensor technology to collect the data. The cross-sectional project benefits from the different expertise of the DLR institutes involved, which work in the fields of aeronautics, space, security, energy and transport, but also in the area of data collection and socio-economic analysis methods.
A map is created layer by layer
Each map consists of individual layers that illustrate certain topics. These are, for example, road types, plant distribution or even the distribution of solar plants. This allows city planners to assess the roads and transport connections needed - not only in their city, but also in the surrounding area. They can also draw comparisons with other cities around the world. Metadata describe the maps in more detail. They enable a quick assessment of the subject matter, spatial accuracy and resolution, but also a quick search with keywords.
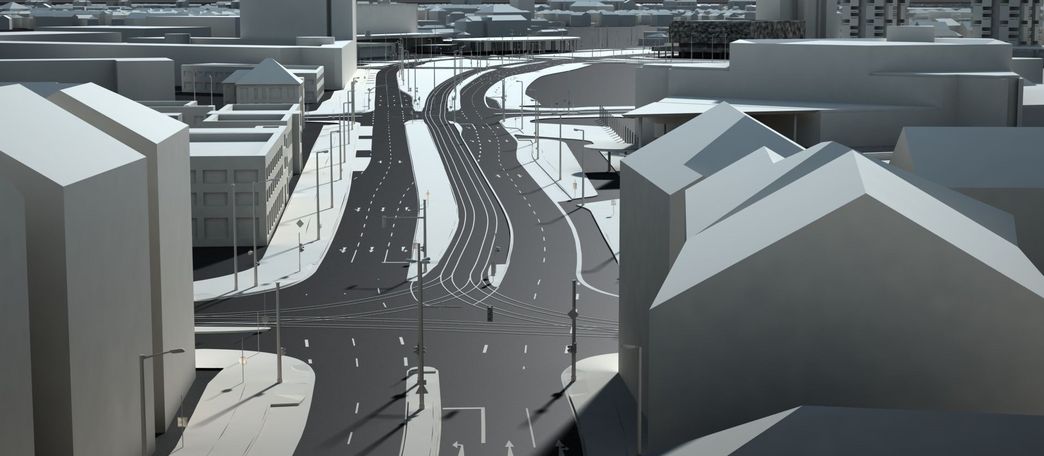
As a first sub-project, a 3D city model of Braunschweig was generated largely automatically at the Institute of Transport Systems Engineering using various sources such as cadastral data, aerial photographs and survey data. Wherever possible, the thematic maps from the raw data are to be processed and verified in this way. The corresponding processes will gradually be developed into an "all-encompassing" geodatabase for overall transport. To ensure that the virtual database comes as close as possible to reality, the researchers are investigating various use cases with different modes of transport. They compare the data from these use cases with each other and use it as the basis for the digital atlas.
Satellites record road condition
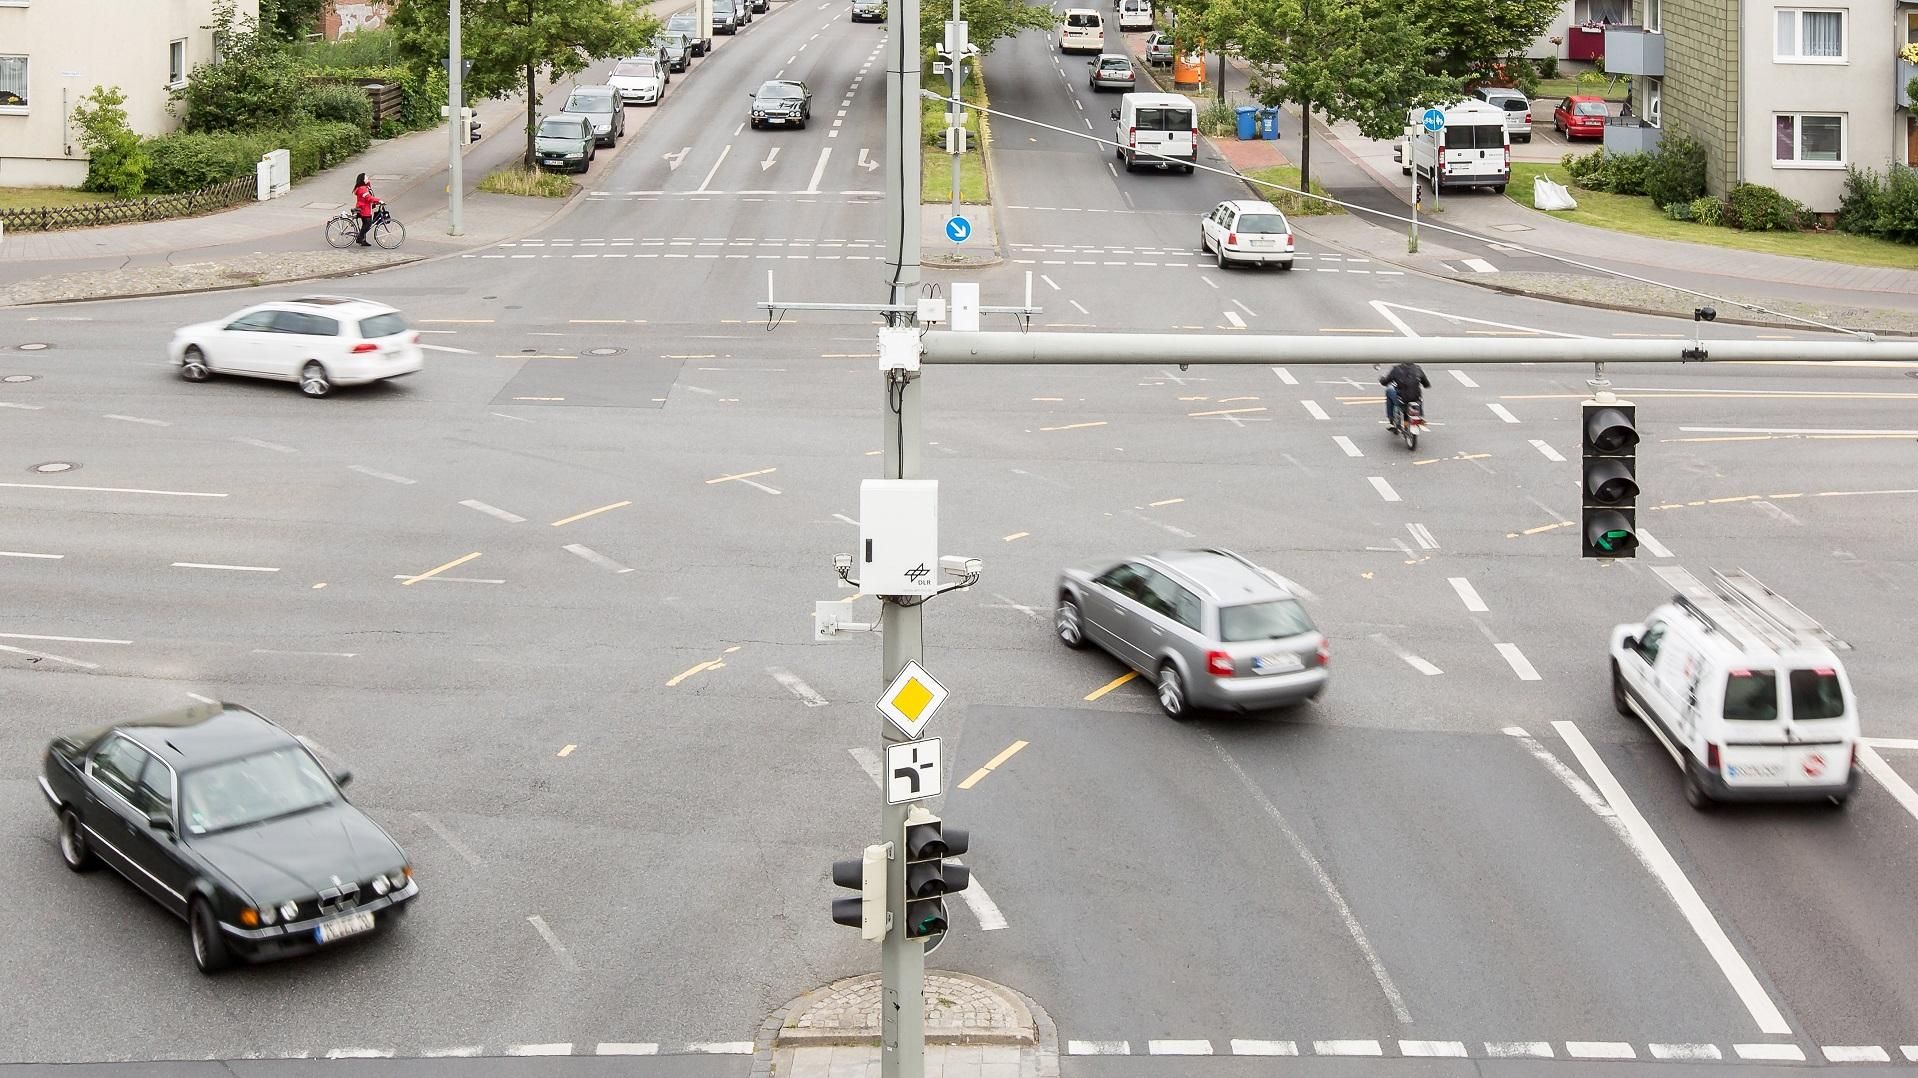
The condition of our roads plays an important role in road safety and fuel consumption. Cracks and potholes cause damage that becomes more widespread if not detected early enough. This is also an important issue for automated or autonomous vehicles. Their sensors must not only recognise infrastructure and obstacles, but also lane markings and the condition of the surface in order to adjust speed and driving style. Up to now, road maps have been generated in a cumbersome way by special vehicles driving along all roads. This is time-consuming and expensive. In addition, in cities, positioning is often only accurate to a few metres due to shadowing such as in narrow streets.
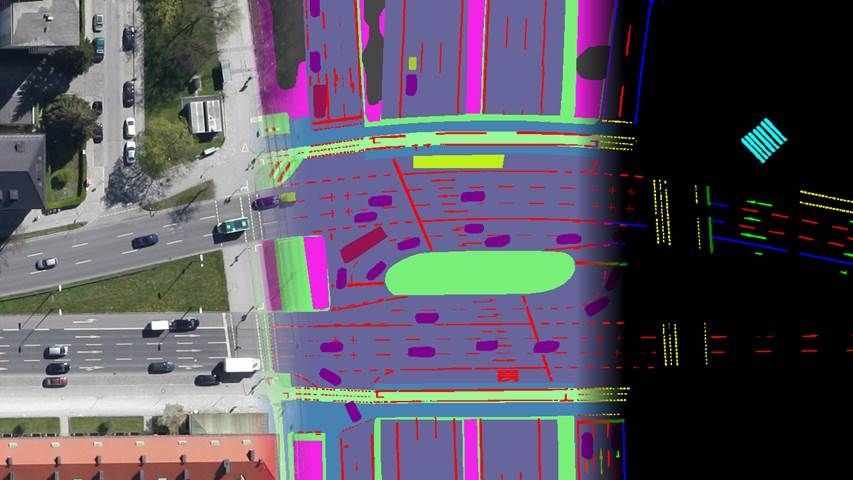
The DLR Institutes of Remote Sensing Technology and High Frequency Technology and Radar Systems in Oberpfaffenhofen are now investigating novel methods to collect the necessary data from satellites and aircraft using imaging radar sensors and high-resolution camera systems. This data can be recorded in a much shorter time and it allows the position of objects worldwide to be determined with an accuracy of less than ten centimetres. This requires highly accurate reference points, which are obtained from the satellite data.
A surface model and a so-called orthomosaic, a distortion-free and true-to-scale image of the earth's surface, are created from the highly overlapping aerial images. This makes it possible to depict roads with all road markings as well as all masts, buildings and vegetation and to integrate them into the digital atlas. Intelligent algorithms recognise the objects with machine learning and assign them accordingly. The researchers determine the condition of the road using black-and-white radar images. Small differences in brightness on the images provide information about the different roughnesses and material properties and make it possible to determine the roughness value in the millimetre range.
Intelligent traffic simulations
The Digital Atlas should also depict future developments and illustrate the consequences of measures. The simulations of traffic models serve this purpose. They show the effects on mobility. For example, this involves the improvement or introduction of new means of transport, the expansion of infrastructure or restrictions for certain road users. The construction of such models requires a variety of data: Information on the population structure, possible destinations and the transport infrastructure and supply. However, more precise knowledge about the size and spatial location of the population is often lacking. The Institute of Transport Research is therefore developing new methods to determine traffic volumes. The advantages: they require less data and also use data that can be collected worldwide by means of remote sensing. This allows the derivation of traffic volume models for any region of the world.
The most important sources for such models include data on land use, settlement patterns, building density and building types. Such information is obtained by the German Remote Sensing Data Center at DLR from high-resolution satellite and aerial image data. From them, for example, the distribution of the population within an area can be derived. The researchers also use the freely available data from the OpenStreetMap project, especially on the road networks stored there. With this, they calculate how well destinations within an area or from a location can be reached by different means of transport. Together with other data, the scientists develop a model of the entire traffic volume. This can be used to study the effects of new mobility offers, such as the use of so-called call buses that travel on individual request.
Dynamic maps for safe ports
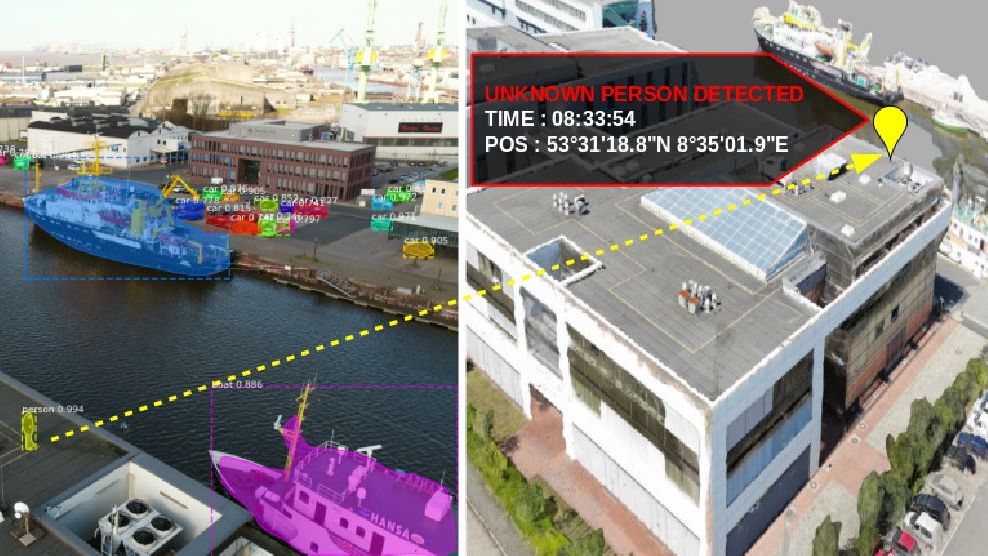
In a port, it is particularly difficult to keep track of all people and goods. The Institutes for Optical Sensor Systems and for the Protection of Maritime Infrastructures are jointly researching to create dynamic, two- and three-dimensional maps in real time. Special sensor systems designed and developed by the institutes are used for this. Real-time implementation is also an essential core of their work. The maps help authorities, emergency forces with security tasks or port and terminal operators to recognise and assess critical situations in time. These are, for example, dangers from suspended loads or unauthorised access to the site. First, the terrain is flown over and high-resolution map material is generated. Then an artificial intelligence recognises ships, road users on the land or objects such as freight containers in images taken on the ground. The software also determines their exact position and integrates the objects into a situation picture. The result is a combined system of aerial camera and ground photographs as well as the associated evaluation algorithms. Incidentally, the maps are also ideal for making autonomous traffic in ports safer.
Predicting the amount of solar power in cities
When will how much electricity from private solar plants be fed into the grid? This is a question to which grid operators urgently need an answer. To do this, they need a basis for recording solar systems on roofs and open spaces - preferably automated. The Institute for Networked Energy Systems is researching this together with the German Remote Sensing Data Centre. In order to record the solar installations, the scientists are analysing high-resolution optical and hyperspectral aerial data from urban areas in Germany. Unlike the human eye, hyperspectral sensors perceive a continuous spectrum of electromagnetic waves, so they can identify objects more clearly based on their spectral properties. Digital elevation models and building shapes are created from the optical and hyperspectral images. In "FlexiGIS", an open-source model developed at the Institute for Networked Energy Systems to simulate urban energy infrastructures, the data is used to simulate the power generation of urban solar systems using Oldenburg as an example. In addition, they help experts to make a spatially and temporally highly resolved prediction of solar radiation by combining it with meteorological satellites - also as an aid for grid operators and thus for the stability of the electricity grid.
In order to record solar installations in cities, scientists analyse high-resolution optical and hyperspectral aerial data of urban areas. The images are used to create digital elevation models and building shapes.
Clear catalogue for diverse user groups
These four examined use cases alone show the complexity of the cross-sectional project. In further scenarios, for example, the aim is to extend the geodatabase and the methods to as many modes of transport and new mobility services as possible - for example to rail transport. But all the results obtained can only be used meaningfully if the digital atlas is comprehensible and clearly structured. That is why one focus of future research is on the further development of a user-friendly catalogue for geodata. All data sets will be stored there and clearly labelled. At the end of the project, the Digital Atlas is to be used in further research projects and, in the long term, also made accessible to administrations and companies.
Text: Dr Rüdiger Ebendt works in the Data Acquisition and Information Retrieval Department of the DLR Institute of Transportation Systems and is scientific director of the Digital Atlas cross-sectional project.
This article first appeared in DLRmagazin 165 of the German Aerospace Center.