Data science, and its long columns of numbers, program codes and formulas, is often very abstract. With the project "The Magic of Data" we tried to present the data our doctoral researchers work with in a sensual and tangible way.
Data in a New Look
A growing number of researchers now work with datasets that are not only vast but also present the subjects of their research in a very abstract way. It’s difficult for outsiders to understand the rows of numbers they contain—so in many cases, the fascinating insights that data can reveal are only accessible to those who conduct research using these data.
That’s why HIDA wanted to give the complex topic of data science a visual form that allowed people to experience it using their senses. The goal was to create a means of accessing modern, data-driven research via the images.

The Magic of Data - HIDA’s Data Animations for the re:publica campus 2020 in Berlin
The animations and visualizations shown here are works of art created by designer Michael Schmitz based on actual datasets. Doctoral candidates at the six Helmholtz Data Science Schools use these data to study a range of topics in the research fields Energy, Earth and Environment, Health, Key Technologies, Matter, and Aeronautics, Space, and Transport.
Turning Data into Images
How can “invisible” numerical values be transformed into spectacular, distinctive works of art?
Michael Schmitz explains that the creative process begins with a vague idea. The designer begins his work by writing an algorithm that serves as a set of rules and “translates” the data points—which initially only exist as numerical values in long Excel lists—into graphical elements such as coordinates, radii, line widths, and radians with the help of a computer program called “Processing”. But the way a concrete result will look after a dataset is run through the algorithm isn’t determined right away, Schmitz says.
Generative Design
These generative graphics are much more than an artistic translation of data, because they are also leading to fundamental changes in the way artists work.
Up until now, the artist was the genius who had control over the process of forming their image or sculpture and shaped its details in line with their own vision. In the case of generative graphics the artist has become someone who programs a set of rules. He or she only determines the parameters within which the object is created. The software generates an image that cannot be predicted according to these fixed definitions. Ultimately, selecting successful results is a creative act of the artist, but the artwork itself is the outcome of an autonomous process. This makes the artist a creative being who establishes the framework within which unpredictable works of art are generated.
The Research Behind the Data Images
Arctic Permafrost
Thawing Dynamics of Arctic Permafrost
TABEA RETTELBACH from HEIBRiDS uses machine learning methods in her research project with the goal of detecting the thawing dynamics of Arctic permafrost based on high-resolution earth observation data.
The dataset used for this picture describes the length and position of some 3,000 columns of ice wedges in the Arctic region of Alaska in July 2019.
Ice wedges are a common phenomenon in Arctic permafrost landscapes. They are created when the ground freezes and ruptures in winter. In spring, these deep cracks are filled with melt water which, in turn, freezes again to become part of the permafrost in the ground. As this process continues over thousands of years, massive wedged-shape bodies of ice form, creating expansive, regularly-shaped structures that look like dry cracks from above.
These ice-filled cracks in the ground are monitored very closely (including with aerial and satellite images) so researchers can draw conclusions on climatic changes, their consequences for the Arctic permafrost landscape, and the accelerating release of carbon dioxide from thawed soil that occurs as a result.
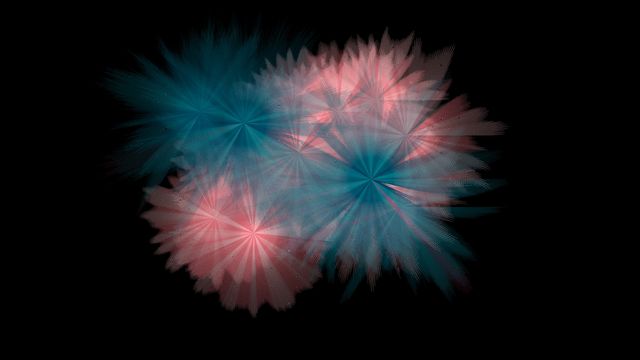
Inner Body Clock
Control Mechanisms of Our Body Clock
VOJTECH KUMPOST from HIDSS4Health uses mathematical models to work toward an understanding of how biological control mechanisms that regulate our internal clock function.
This picture is based on data from the simulated cyclical oscillation behavior of three different proteins. The time is specified in hours, while the concentration is set in random units.
Our bodies have an internal clock that tells us when it’s time to sleep, eat, or be active. This internal clock can also be observed at the level of individual cells, where concentrations of proteins fluctuate in sync with the 24-hour cycle of day and night.
The data represented here were generated by a mathematical model that describes this vibration behavior (“cyclical oscillation”). These data are used to gain a better understanding of the control mechanisms that make our internal clock tick at the right pace. Analyzing these mechanisms is important because any disruption of our internal clock (due to jet lag, shift work, or genetic mutations, for instance) leads to a lower quality of life and deterioration in health (such as poor quality of sleep, depression, and diabetes).

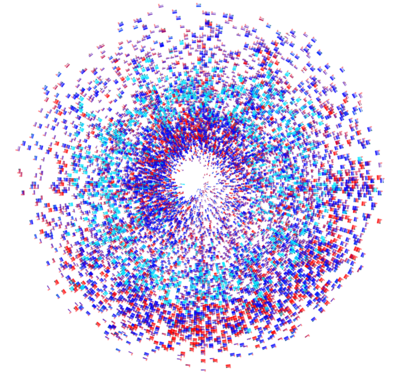
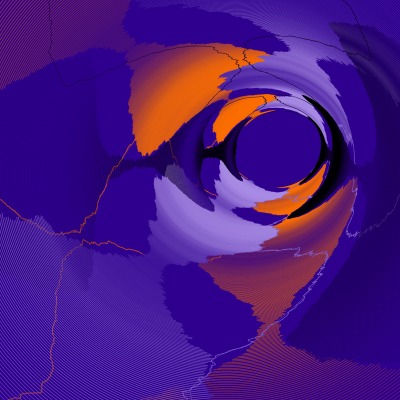
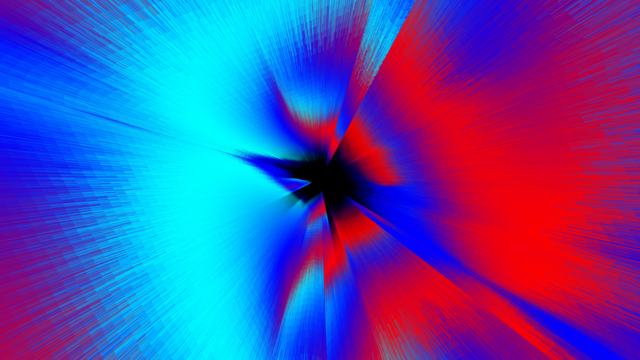
Brain Activity 1
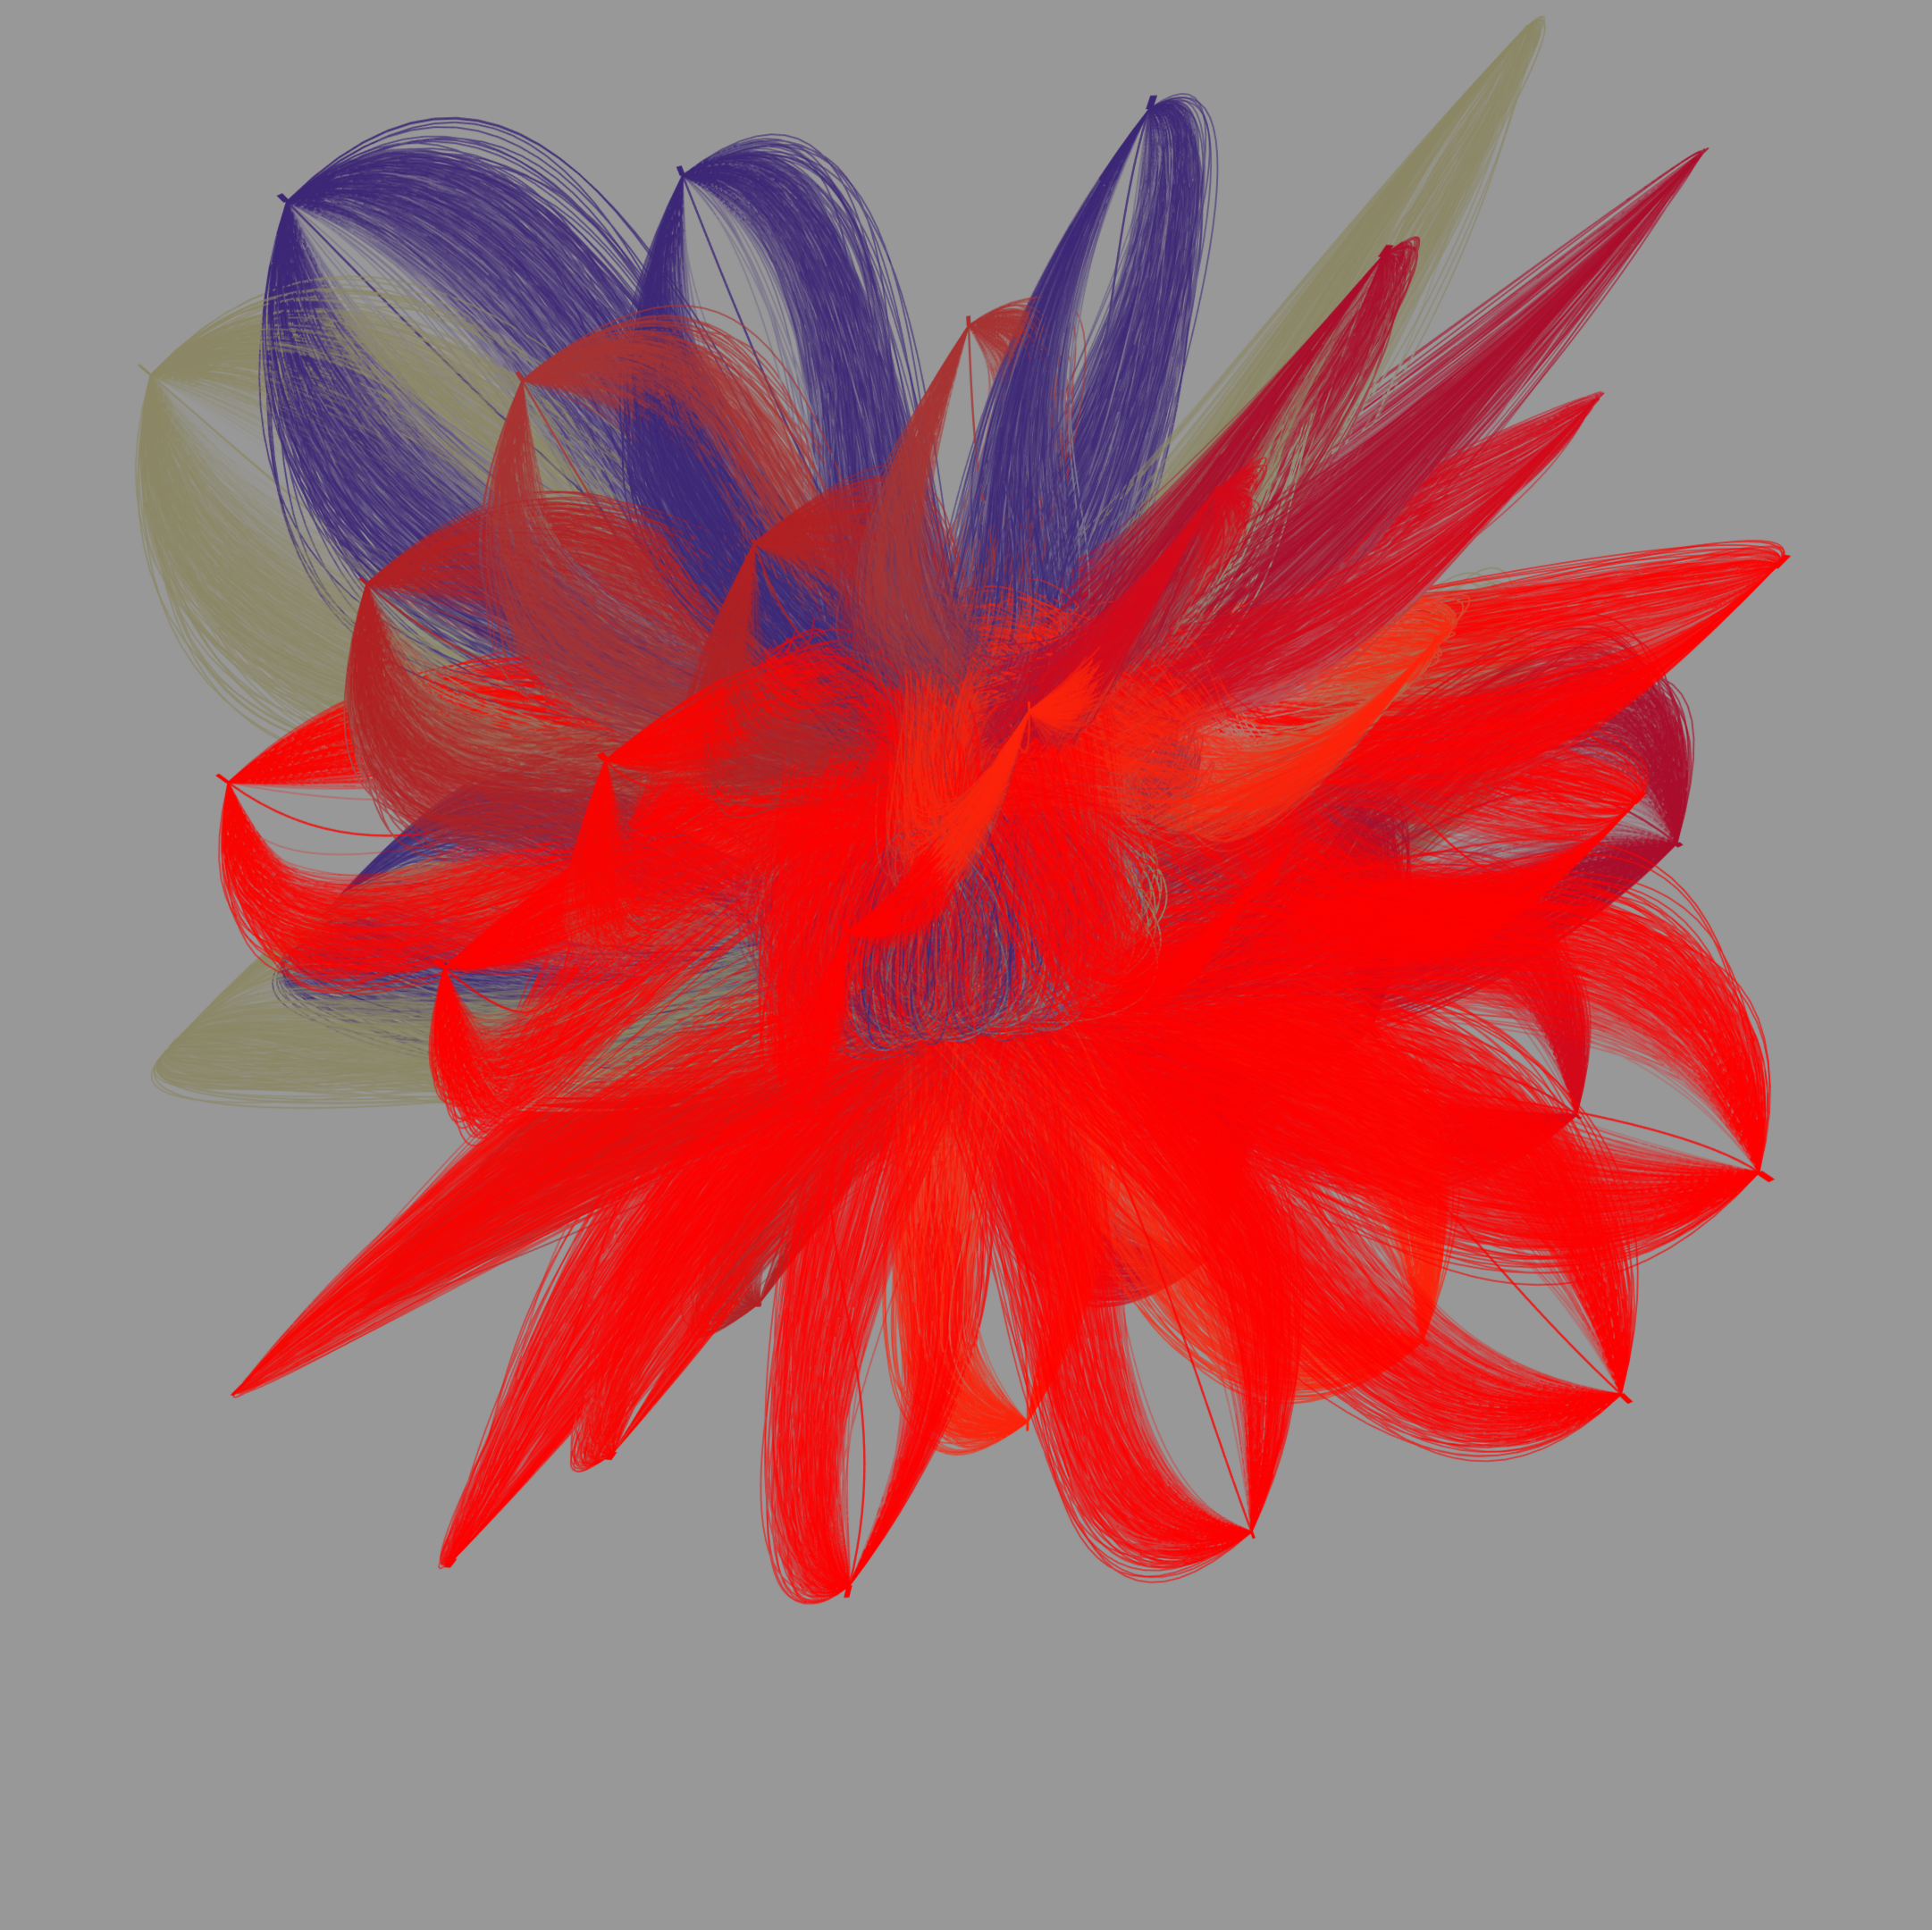
Synchronous Brain Activity
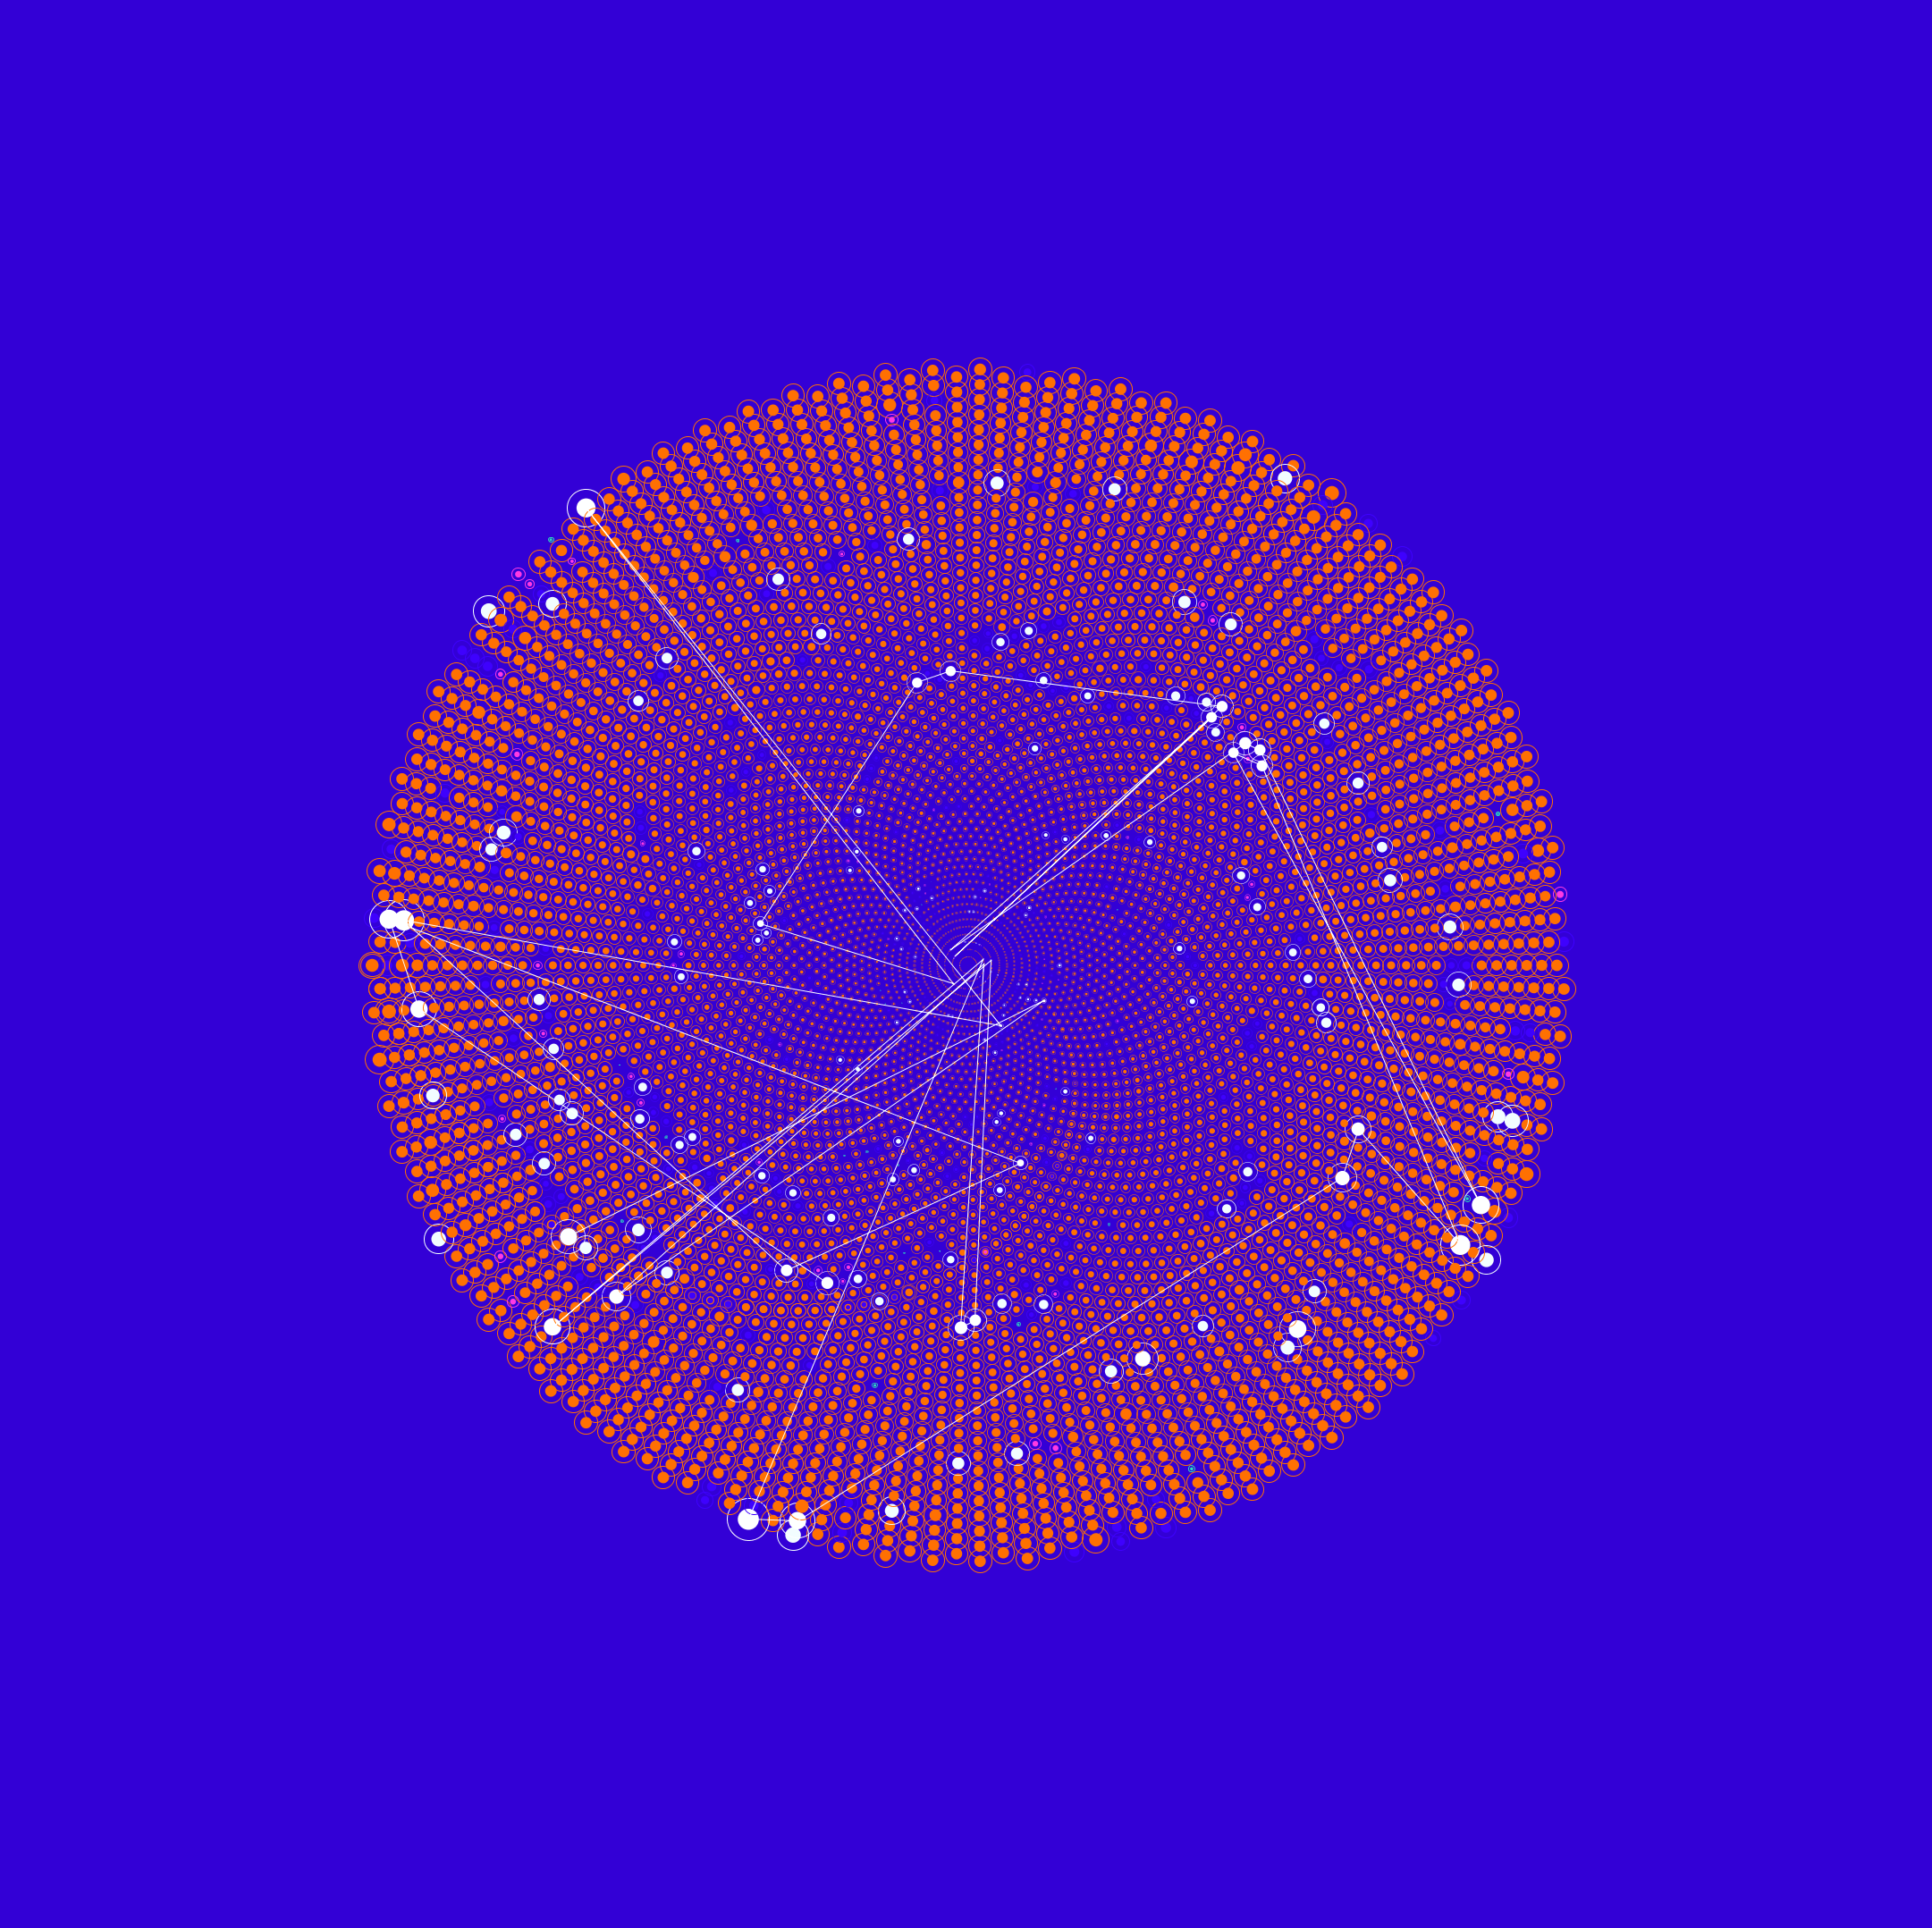
CHRISTIAN GERLOFF from HDS-LEE applies artificial intelligence and machine learning methods to the neurosciences to gain a better understanding of the human brain.
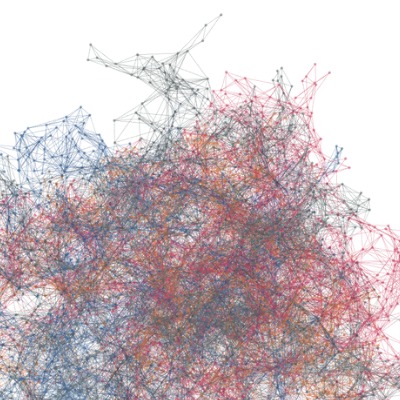
The dataset on which this picture is based contains signals from 22 different regions of the human brain. The respective data come from two participants who were interacting with each other as part of an experiment and relate to the brain region, the source, the measuring point coordinators, and the rate at which concentrations of oxyhemoglobin change.
The data were recorded simultaneously and provide information on the concentration of oxyhemoglobin in the individual areas of the test subjects’ brains. A technique called functional near-infrared spectroscopy (fNIRS) is used to capture the data. During this process, infrared light is directed through the test subjects’ scalps, and the reflected light is then measured. This makes it possible to track where blood is directed to in the brain—presumably because the neurons in this area become more active during a mental task. Researchers hope that experiments like these will yield insights into the way two brains cooperate when solving a task together.
The picture shown here and the subsequent image show how different the visualizations can turn out depending on the way the underlying algorithm selects the available shaping elements. Even though the input data are identical, the algorithm “translates” them into different graphical elements.
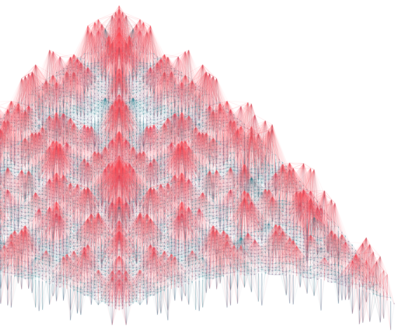
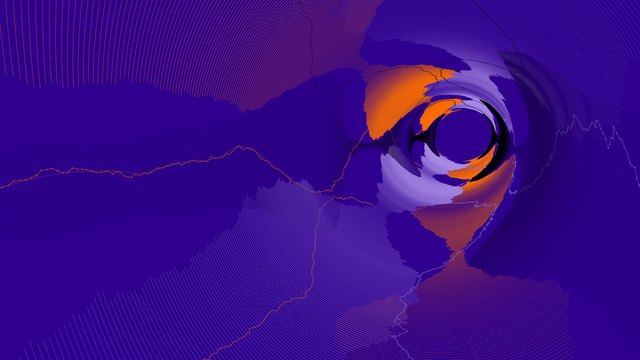
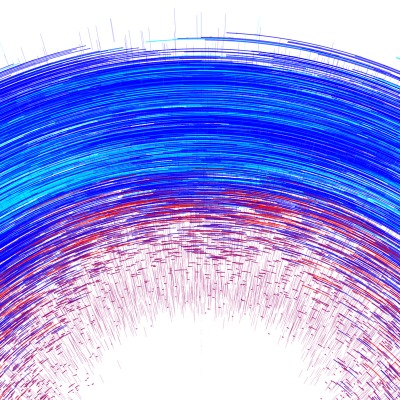
Brain Activity 2
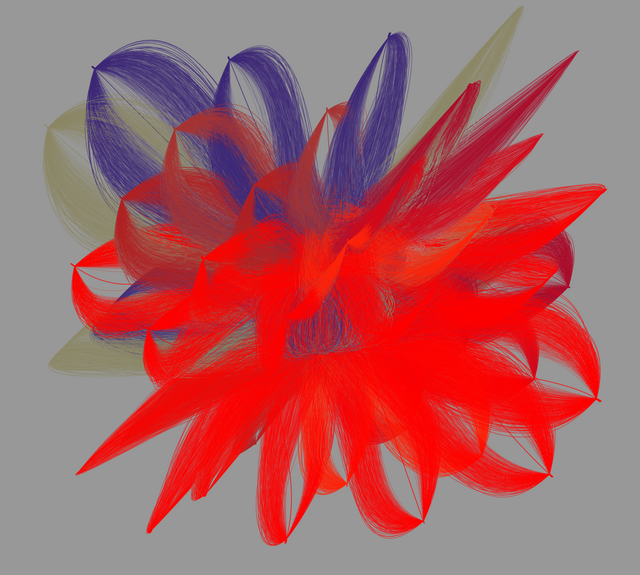
Synchronous Brain Activity
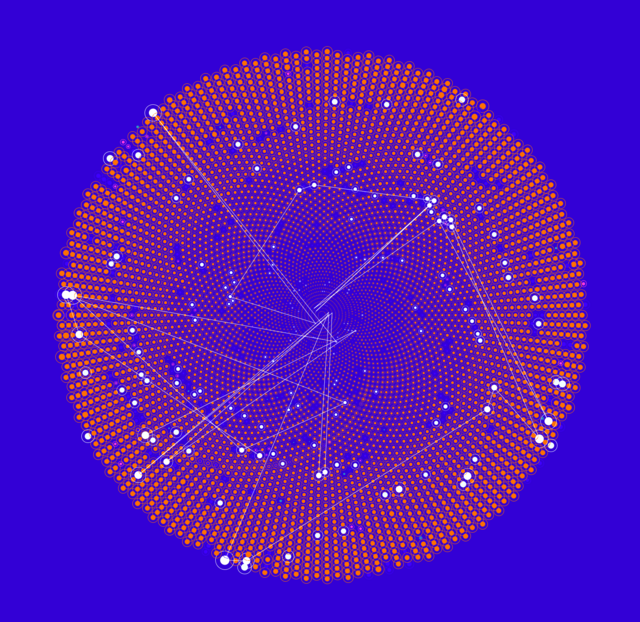
CHRISTIAN GERLOFF from HDS-LEE applies artificial intelligence and machine learning methods to the neurosciences to gain a better understanding of the human brain.
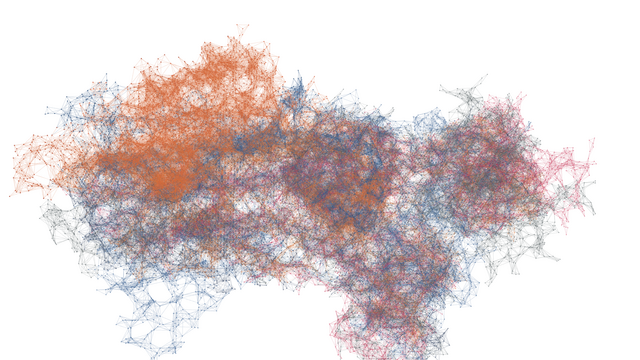
The dataset on which this picture is based contains signals from 22 different regions of the human brain. The respective data come from two participants who were interacting with each other as part of an experiment and relate to the brain region, the source, the measuring point coordinators, and the rate at which concentrations of oxyhemoglobin change.
The data were recorded simultaneously and provide information on the concentration of oxyhemoglobin in the individual areas of the test subjects’ brains. A technique called functional near-infrared spectroscopy (fNIRS) is used to capture the data. During this process, infrared light is directed through the test subjects’ scalps, and the reflected light is then measured. This makes it possible to track where blood is directed to in the brain—presumably because the neurons in this area become more active during a mental task. Researchers hope that experiments like these will yield insights into the way two brains cooperate when solving a task together.
The picture shown here and the previous image show how different the visualizations can turn out depending on the way the underlying algorithm selects the available shaping elements. Even though the input data are identical, the algorithm “translates” them into different graphical elements.
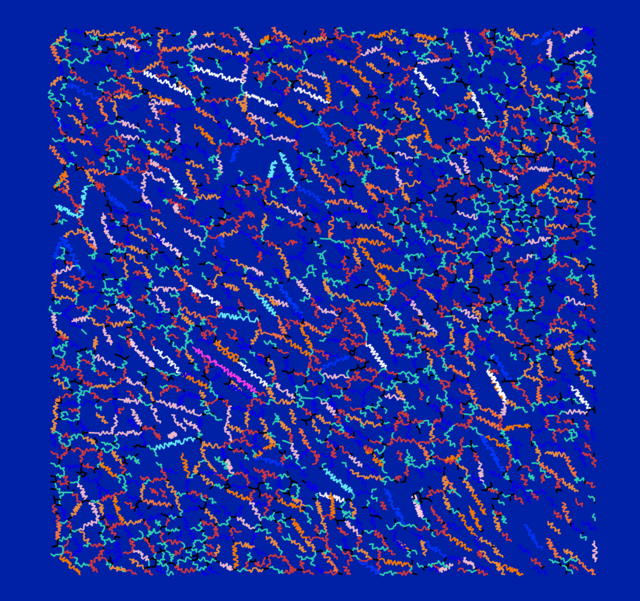
Cell Nucleus Movement
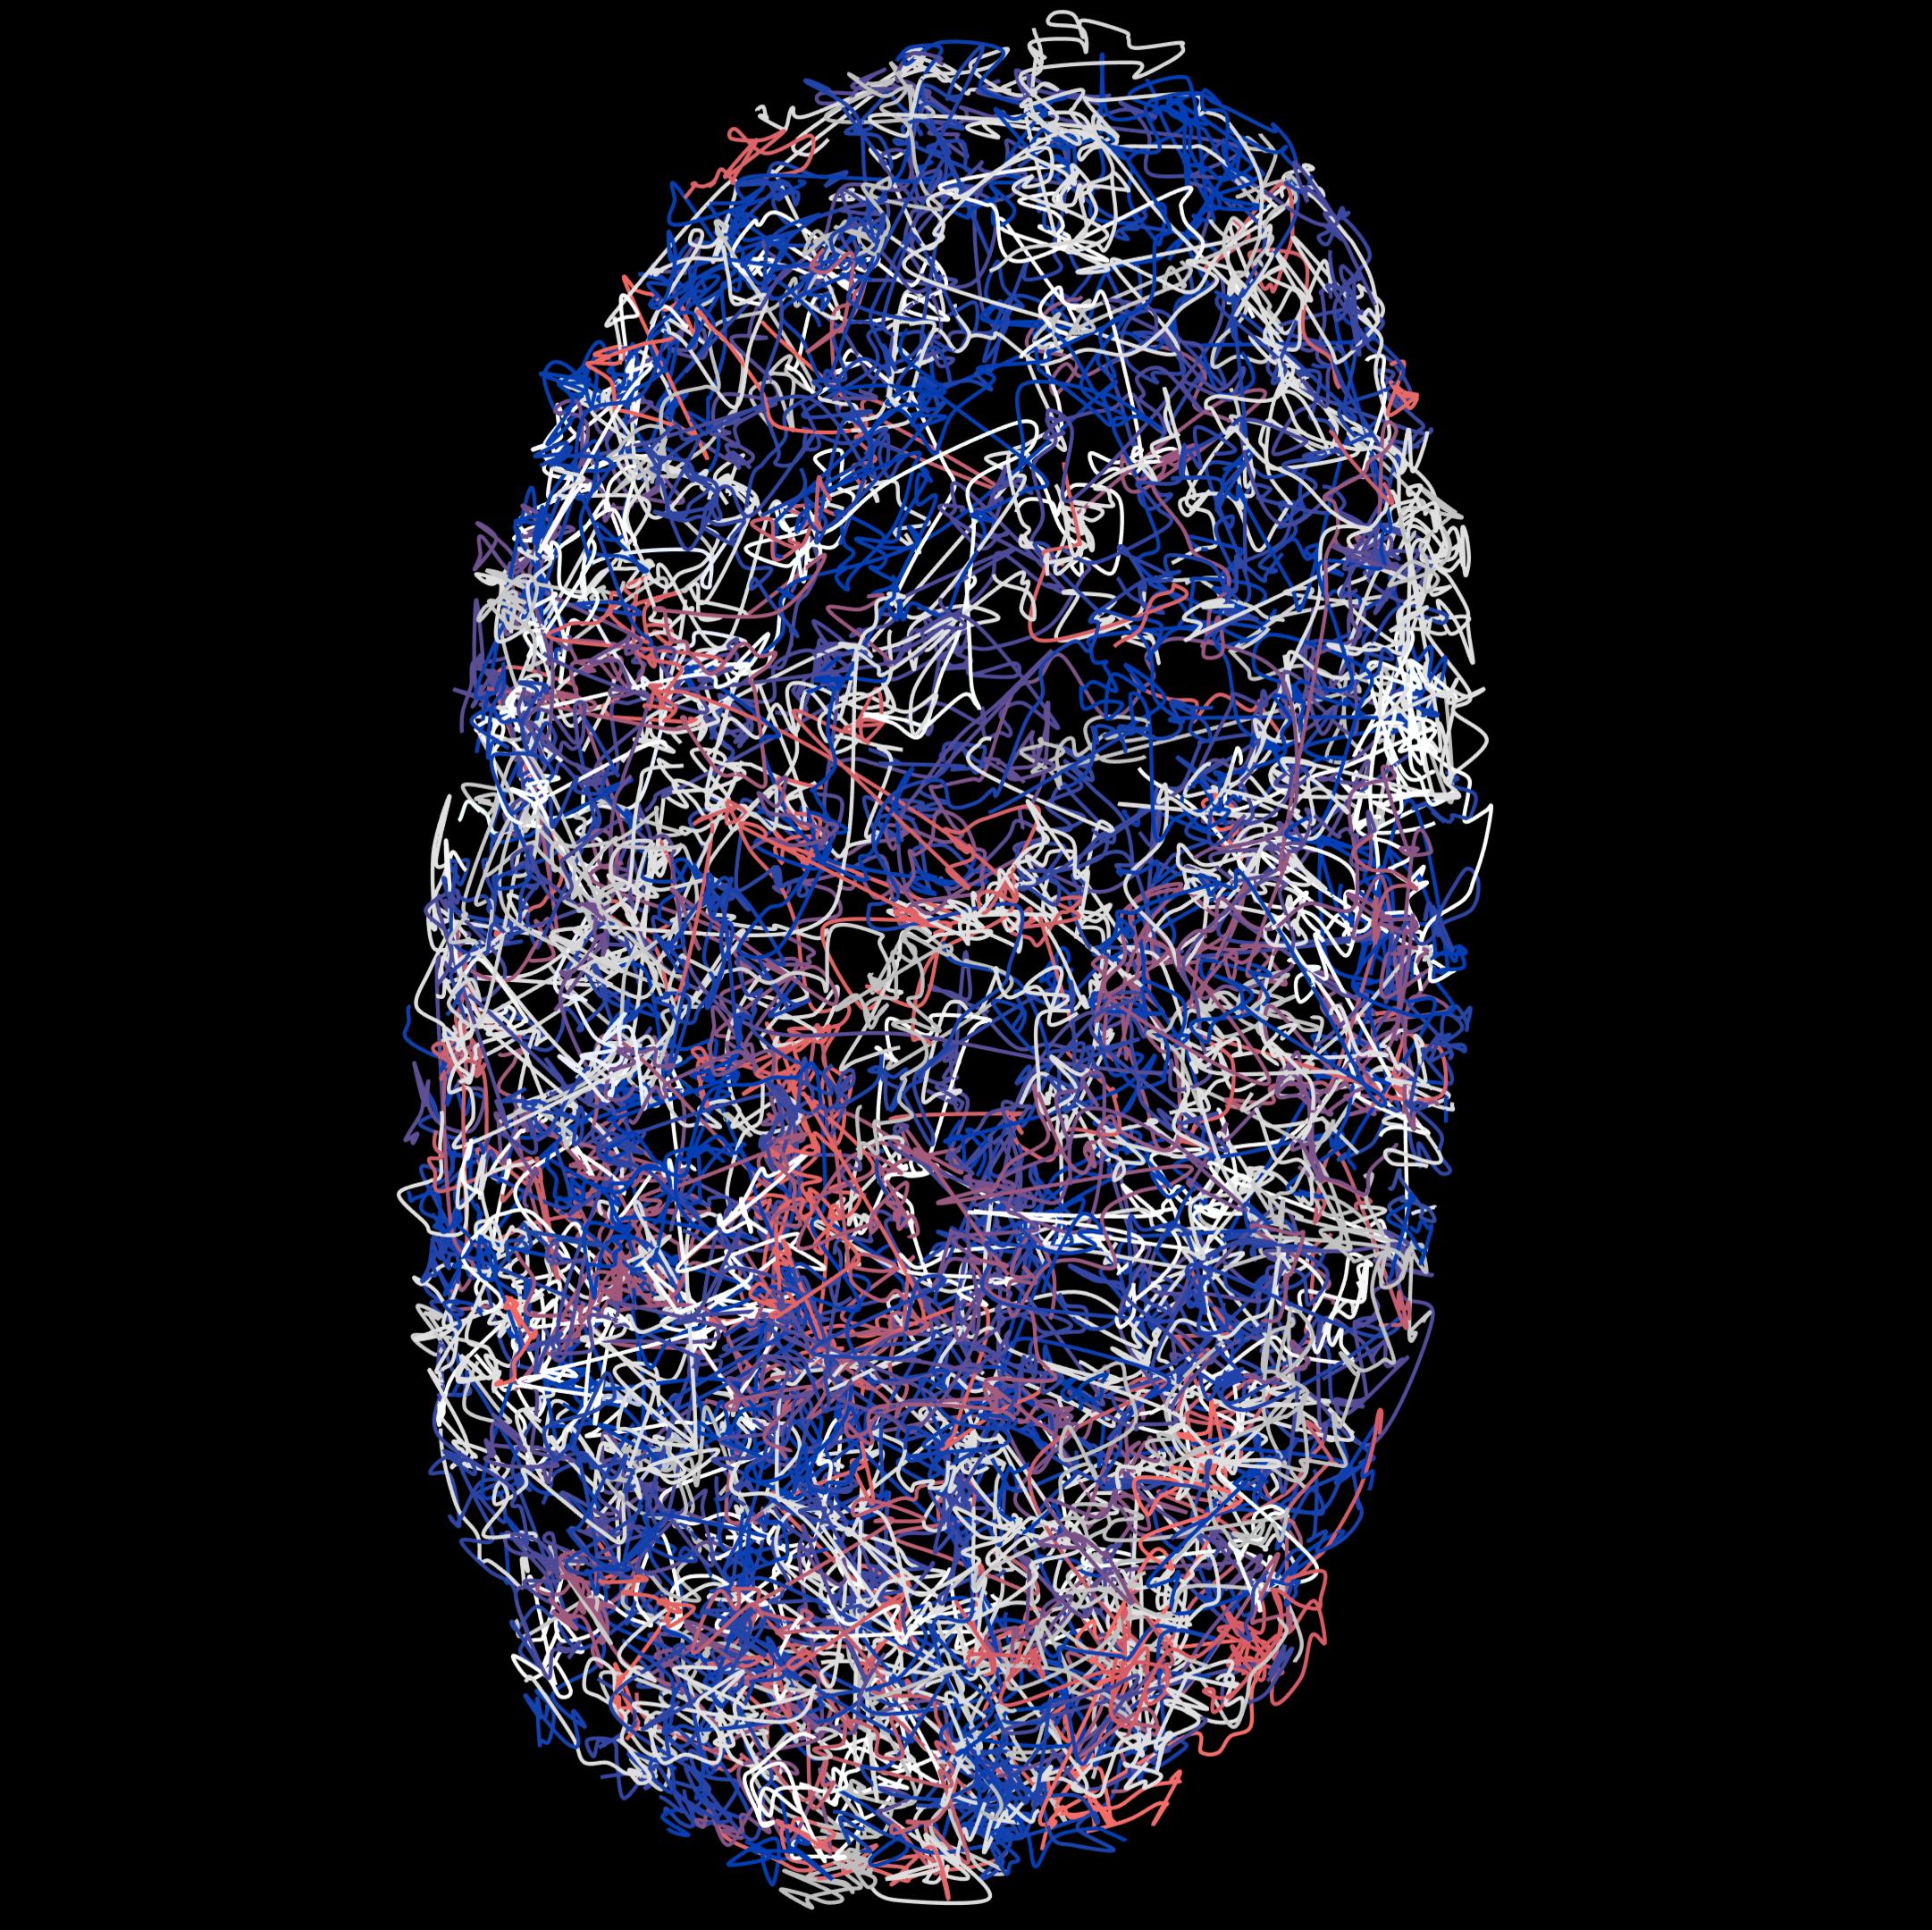
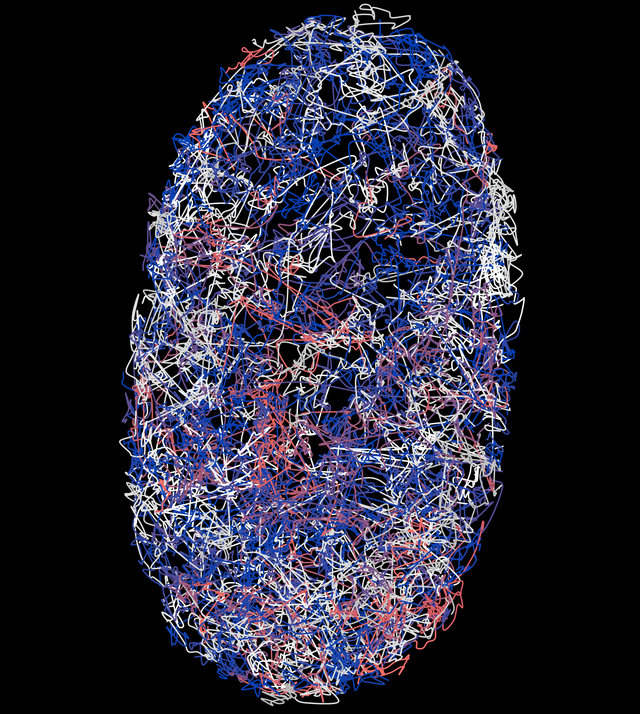
Cell Nucleus Movement
KATHARINA LÖFFLER from HIDSS4Health wants to use machine learning methods to calculate how cell nuclei move so she can gain a closer insight into the development of organs and how diseases come about.
The data used here comprise the positions of the cell nuclei (z, y, x) of the cells that are tracked over time. Löffler looked at cells from the C. elegans roundworm in this analysis.
Many biomedical imaging devices are capable of capturing high-resolution 3D data over time (3D+t, t = time). These data can be used to track cells as time progresses, for example, and the cells are marked with fluorescent substances for this purpose. Images of the cells are then captured under a light sheet microscope before analyzing the movement data from the images with the help of algorithms.
Typical imaging methods like those used to identify cell nuclei, for example, have a precision rate of around 95 percent. This sounds good at first. But it’s still not enough for an error-free reconstruction of the entire cellular lineage (consisting of all cell nuclei movements and cell divisions that a cell undergoes over the course of its development). Gaining more precise information on these movements is helpful in terms of arriving at a better understanding of how cells differentiate and structure the different organs in an organism. For this reason, the project’s goal is to improve 3D+t tracking algorithms.
The data collected here aim to provide a quantitative description of cell death, division, movement, and interaction—by looking at the example of the development of the C. elegans roundworm, a popular model organism.
X-Ray Data Analysis
X-Ray Data Analysis
STASIS CHUCHURKA from DASHH uses data science methods to conduct research into the development of a single model for analyzing X-ray data in order to gain a better understanding of the electronic structures of substances and their subsequent chemical processes.
The data used for this picture pertain to the electronic charging density of urea. They comprise the density matrix elements and two corresponding atomic orbitals each.
Characteristics of chemical substances are strongly influenced by their electronic structure. Subtle changes in the electronic structure are of key significance when it comes to understanding chemical processes, such as photosynthesis or catalysis. However, current simulations of these structural changes do not provide an acceptable degree of precision and require extensive computing time. On the other hand, experimental data on their own do not provide complete information on the electron structure, either.
In order to solve this problem, experimental and theoretical approaches need to be systematically combined. For this reason, the research project is being conducted on an interdisciplinary basis involving both the natural sciences and mathematics in order to develop a new, uniform model for analyzing X-ray data using calculating methods from the data sciences. This model is to combine data from various experimental approaches that otherwise can only be analyzed separately, such as data from X-ray diffraction and X-ray emission spectroscopy measurements.

Metabolic Processes
Metabolic Processes
JOHANN FREDRIK JADEBECK from HDS-LEE is working on computer-based methods to understand better at which speed metabolic processes occur in microorganisms
The data represent the frequency distributions (based on a representative sampling procedure) of individual metabolic reaction rates (fluxes) in the bacterium Escherichia coli.
Metabolism describes the biochemical processes that take place inside cells: How do cells gain energy from nutrients to grow? How do they conduct material flows to produce certain substances? It is uncertain at what speed (called "fluxes" for short) these reactions take place. Biotechnologists are interested in fluxes in living cells because they allow conclusions on how, for example, a better yield of a substrate can be achieved. Reaction strengths are also interesting for medicine, for example in drug research: How do the fluxes of healthy and diseased cells differ? And how does a drug affect them?
However, the metabolic reaction rates inside the cells of microorganisms cannot be measured directly. This is where indirect information from carbon labeling experiments can help: For this purpose, molecules that are taken up by the organisms are "labeled" beforehand so that conclusions can be drawn about the metabolic process that has taken place based on the concentration of the specific labeling patterns of these molecules in the cells. Computer models can be used to determine the flows from these measurement results. Data-scientific calculation methods help to determine them even more precisely.
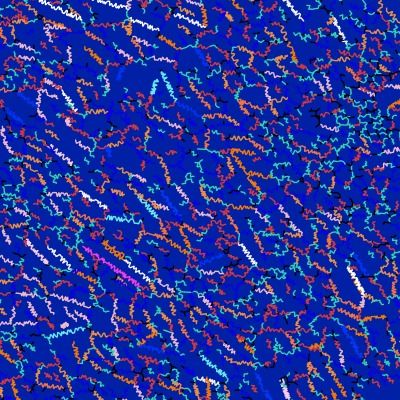
Self-Navigation
Self-Navigation
FELIX FIEDLER from HEIBRiDS wants to use methods of artificial intelligence to make complex data analysis for self-localization systems energy efficient and powerful
The data used for this graphical conversion includes longitude and latitude, time and speed.
The ability for self-localization is crucial for all tasks where autonomous decisions have to be made, e.g. by robot vehicles on planetary exploration missions. A navigation system that can do this does not need an external reference such as satellite data to determine a point in space.
This representation is based on the data that should make such navigation possible: A person, a vehicle or similar is equipped with a device that tries to infer the relative position (with respect to the starting point) and the speed. Data from different sensors (camera and accelerometer) are combined and calculated to make the most plausible prediction. The goal is to enable future navigation devices to perform this computational "fusion" of sensor information with highest accuracy and low energy consumption. For this purpose new algorithms and machine learning techniques are developed.
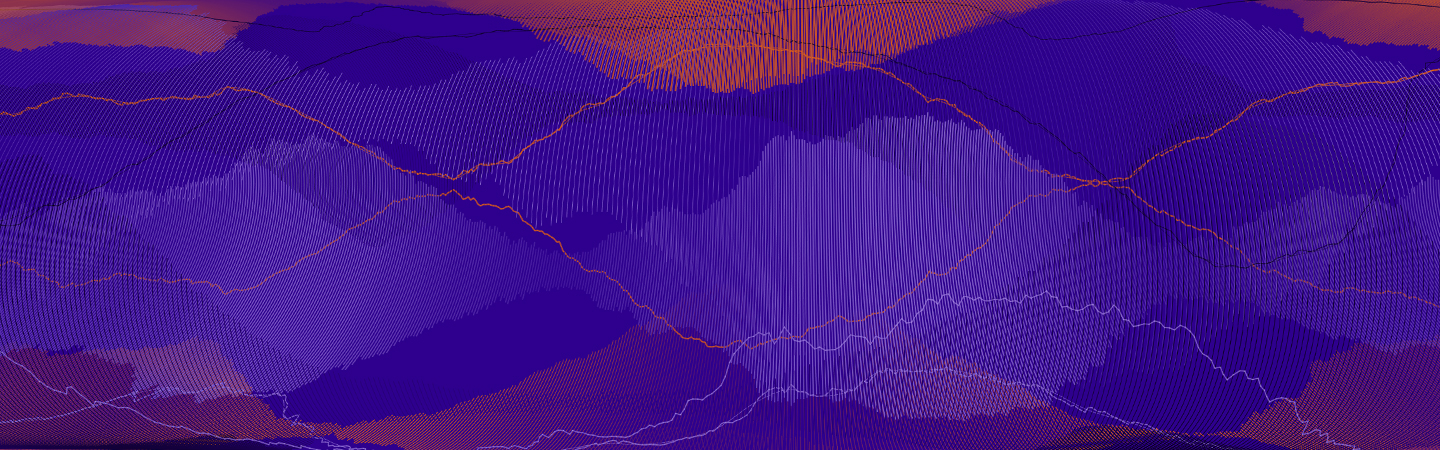
Ozone Concentration
Ozone Concentration
HELGE MOHN from MarDATA wants to use neural networks to determine changes in ozone concentration in the atmosphere with low computational effort and high accuracy so that climate models can make better predictions.
The representations are based on data used to calculate the ozone change rates. The temporal input is the day of the year; the spatial information is given by latitude and altitude. In addition, there are various other parameters (solar energy, temperature and the chemical concentration of various compounds of chlorine, bromine, nitrogen oxide and hydrogen).
Current chemical models in Earth system modeling can represent physical and chemical processes in detail. They contain hundreds of chemical substances and reactions that are integrated into complex equations. Large computational clusters are often required to solve them. If such chemical models are to be coupled with climate models - for example, to predict the effects of changes in the chemical composition of the atmosphere on climate - this is only possible if the computing time is increased considerably. However, the inclusion of detailed chemistry in climate models is desirable in order to take into account the various feedbacks between chemical processes, the atmosphere, and especially the ocean. The concentration of ozone as a particularly climate-relevant atmospheric gas in the stratosphere is an important parameter in this context.
SWIFT, an already existing ozone chemistry calculation scheme, addresses this question. It already allows the creation of an interactive ozone layer for global climate models without long computing time. Neural networks are now to improve the existing methodology at SWIFT. They are better able to detect non-linear changes in chemical compounds, which makes climate predictions even more accurate.

Earthquake Prediction
Earthquake Prediction
JANNES MÜNCHMEYER from HEIBRiDS wants to use methods of artificial intelligence to evaluate earthquakes and their probable strength faster than before
The data used for this graphical conversion refers to earthquakes in northern Chile in 2014 and includes earthquake strength, time units, longitude and latitude, depth in kilometers and measurement inaccuracy of earthquake strength.
Earthquakes emit two basic types of waves: fast moving but less energetic pressure waves and so-called shear waves, which are slower moving but very energetic and therefore cause damage.
Early warning works by estimating the quake from the pressure waves arriving first, so that one can warn of the dangerous shear waves with a lead-time of up to 20 seconds. Previous algorithms based on relatively few wave characteristics are quite well suited for estimating earthquakes up to a moment magnitude of 6.5. For larger earthquakes, however, the total break time of the quake is usually longer than the typical warning times. This means that the first damaging waves arrive while the earthquake itself is still progressing and may become stronger.
The goal is to develop new algorithms that can calculate the final fracture duration of an earthquake based on the first few seconds of the pressure waves and taking into account additional data.
Enzyme Structures
Enzyme Structure Prediction
PIA STAMMER from HIDSS4Health aims to use mathematical methods to predict more accurately the effects of uncertainties in irradiation in order to enable patients to receive treatment with fewer side effects
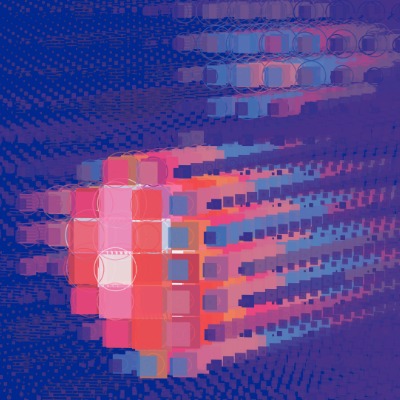
The following data was processed in the presentation: The expected dose distribution, the dose variance with respect to the possible sources of uncertainty, the spatial coordinates x, y, z and the tissue density at these coordinates (in Hounsfield units).
Radiotherapy is one of the cornerstones of modern cancer treatment, which is used in 50% of all patients. It is a highly personalized treatment based on a computerized patient model (based on CT images) and on a simulation of the radiation dose introduced into the patient's body. This allows the treatment to be optimized before starting therapy. In clinical practice, however, only one treatment scenario based on the most probable assumptions can be run through at any one time. However, such a simulation does not include all sources of uncertainty: In addition to measurement errors during CT acquisition, possible misalignment during immobilization of the patient, changes in the patient's anatomy during the treatment session (e.g., due to breathing) or between sessions (e.g., due to weight loss) can lead to inaccuracies.
With modern methods of mathematical uncertainty determination, these deviations should be calculated in order to adjust the irradiation even better. In this way, negative effects caused by a too high or too low radiation dose can be minimized.
Radiotherapy
Radiotherapy
PIA STAMMER from HIDSS4Health aims to use mathematical methods to predict more accurately the effects of uncertainties in irradiation in order to enable patients to receive treatment with fewer side effects
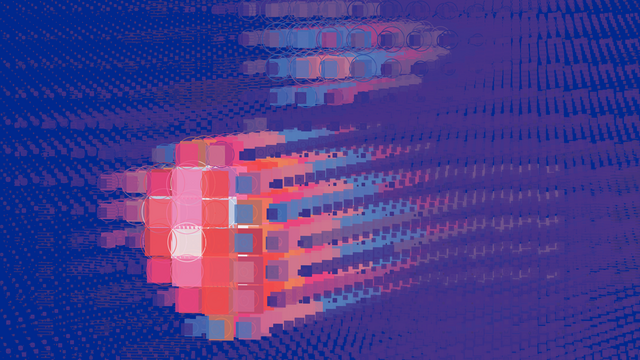
The following data was processed in the presentation: The expected dose distribution, the dose variance with respect to the possible sources of uncertainty, the spatial coordinates x, y, z and the tissue density at these coordinates (in Hounsfield units).
Radiotherapy is one of the cornerstones of modern cancer treatment, which is used in 50% of all patients. It is a highly personalized treatment based on a computerized patient model (based on CT images) and on a simulation of the radiation dose introduced into the patient's body. This allows the treatment to be optimized before starting therapy. In clinical practice, however, only one treatment scenario based on the most probable assumptions can be run through at any one time. However, such a simulation does not include all sources of uncertainty: In addition to measurement errors during CT acquisition, possible misalignment during immobilization of the patient, changes in the patient's anatomy during the treatment session (e.g., due to breathing) or between sessions (e.g., due to weight loss) can lead to inaccuracies.
With modern methods of mathematical uncertainty determination, these deviations should be calculated in order to adjust the irradiation even better. In this way, negative effects caused by a too high or too low radiation dose can be minimized.
We are beginning to understand that science is not the only way we can gain an insight into the tangled workings of nature. Artistic interpretations present us with one such way.
Hermann von Helmholtz
HIDA Offers You the Data Visualizations for Use
You would like to use HIDA's generative data visualizations? Under this link, you can download a large selection of the graphics presented here for private or journalistic use. Click here for an overview of the motifs. However, we ask you to consider the following when using them:
The graphics are licensed under the Creative Commons License CC BY-SA 4.0, which means: The images may be copied and used in any format, and may be edited. The only requirements are: The images must be credited with "Michael Schmitz for Helmholtz/HIDA" and a link to the HIDA website: www.helmholtz-hida.de. In addition, edits must be indicated.
Contact

Xenia von Polier
Communication & Marketing Manager
Contact

Laila Oudray
Communication & Marketing Manager
Contact