Climate data from sea and ice
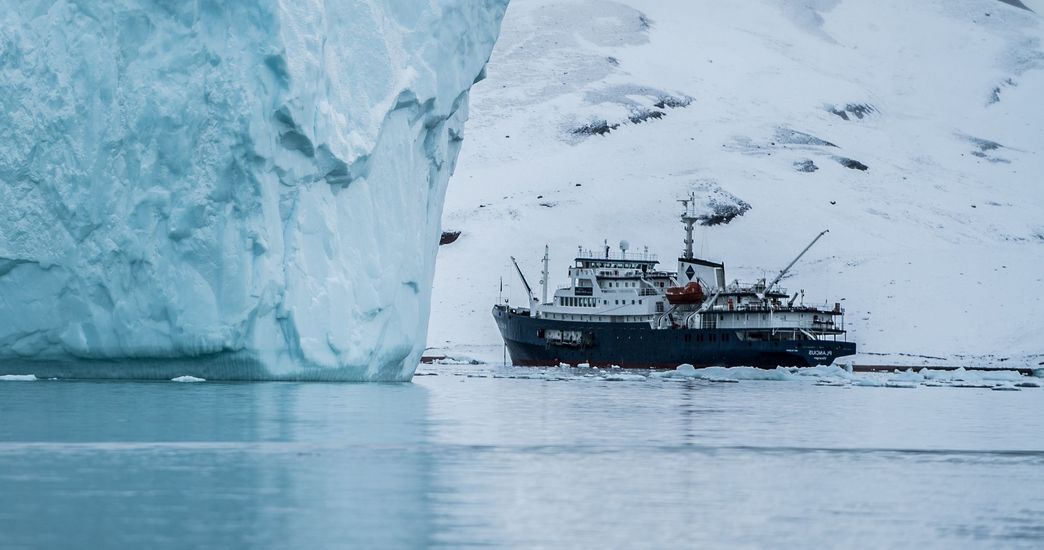
A better understanding of climate variability helps to calculate how high global warming could be in the coming decades. Andrew Dolman and his team at the Alfred Wegener Institute (AWI) rely on complex data material from sea and ice.

While ‘climate change’ is all over the news these days — and for good reason — there is noticeably less discussion about ‘climate variability’, which also plays an important role in helping to determine the range of possible extreme events in future climate and can contribute to managing climate risks in societies worldwide further down the line. Andrew Dolman and his team at the Alfred Wegener Institute Helmholtz Centre for Polar and Marine Research AWI are looking to data science to get a clearer picture of the earth’s climate futures.
For example, we know the world will be warmer in the future, but climate variability helps forecast how much hotter certain decades will be compared to the average. In essence, climate variability looks at the way elements, such as temperature, rainfall and wind, deviate from the average value over a period of time, beyond individual weather statistics.
The Earth System Diagnostics research team at the Alfred Wegener Institute (AWI) Helmholtz Centre for Polar and Marine Research use geological data, statistical processes and climate models to better understand climate variability over long time-scales – so, over 10-year, 100-year and 1000-year time periods. “To do this, we have to look for records of the past climate in historical data sets but these only go back about 170 years,” explains Dolman, who has always been interested in science, especially in ecology and the natural world.
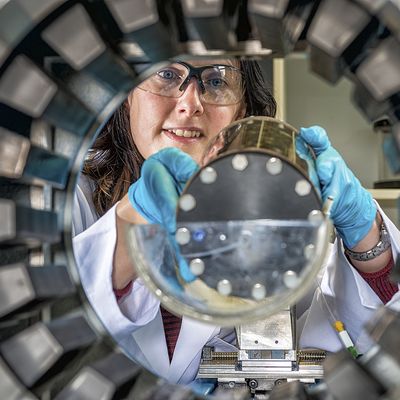
”For longer periods of time, we need to look at ice cores and sediment cores from the ocean floor. Tiny marine animals preserved in the sediment can tell us something about the past climate because the ratio of chemicals in their shells changed with temperature. By measuring the ratio of these chemicals in old shells, we have a ‘proxy’ measurement of the temperature in the past.”
"Tiny marine animals preserved in the sediment can tell us something about the past climate because the ratio of chemicals in their shells changed with temperature."
Andrew Dolman, Researcher at the AWI
Looking into climate variability over longer periods of time
While Dolman studied ecology in university, it wasn’t until after he completed his Ph.D. that he began working on the ecology of lakes, rivers and coral reefs. Since starting his position at AWI in Potsdam more than three years ago, he’s shifted to focus more on what we can learn by studying records about the past climate that are preserved in ice cores and sea sediment.
“While climate models are good at projecting how the average temperature will change in the future if we keep adding CO2, they’re not as good at estimating the variability in the future, especially what the difference will be like between centuries in the future,” he says. “This is because we don’t know as much about how different centuries were like in the past. Although we have some records, the further into the past you go, the more uncertain the records are.”
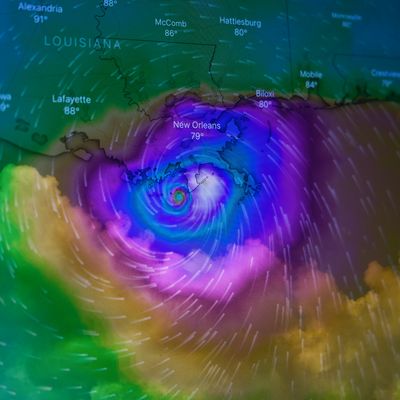
Ocean currents play a major role in moving heat around the earth
Since 71 percent of the earth is covered by oceans, ocean currents play a major role in moving heat around the earth. This heat, says Dolman, is transferred to the atmosphere and also influences moisture transfer which, in turn, affects cloudiness and rainfall. Even slight changes in ocean temperatures can shift both climate and weather patterns on land. Luckily, there’s a fairly comprehensive data of sea surface temperature (SST) across all oceans over different points in time.
“One of the reasons that sea surface temperature is such an important influence on our research in climate variability is because it’s the most frequently measured temperature, both by us now, and by ships in the past recording the water temperature as they crisscrossed the ocean,” he says. While there is a large amount of data over a gigantic virtual grid that spans oceans across the globe over various time periods, scientists are finding it difficult to figure out how closely to zoom into the granular details to spot larger trends.
“We have a quick-fix solution at the moment, but we would like to improve it,” adds Dolman. Looking ahead, the Earth System Diagnostics research team at AWI would like to collaborate with data scientists and specialists to find a better solution and gain a more comprehensive understanding of climate variability in the long run.
Author: Charmaine Li